3.2 - Chart Manipulated to tell Fake Story
3.1 - Chart Actual
2 - SVG Sketch
2013
2014
2015
2016
2017
2018
2019
2020
2021
2022
2023
Year
Rainfall drop
0
60
Total Rainfall (in.)
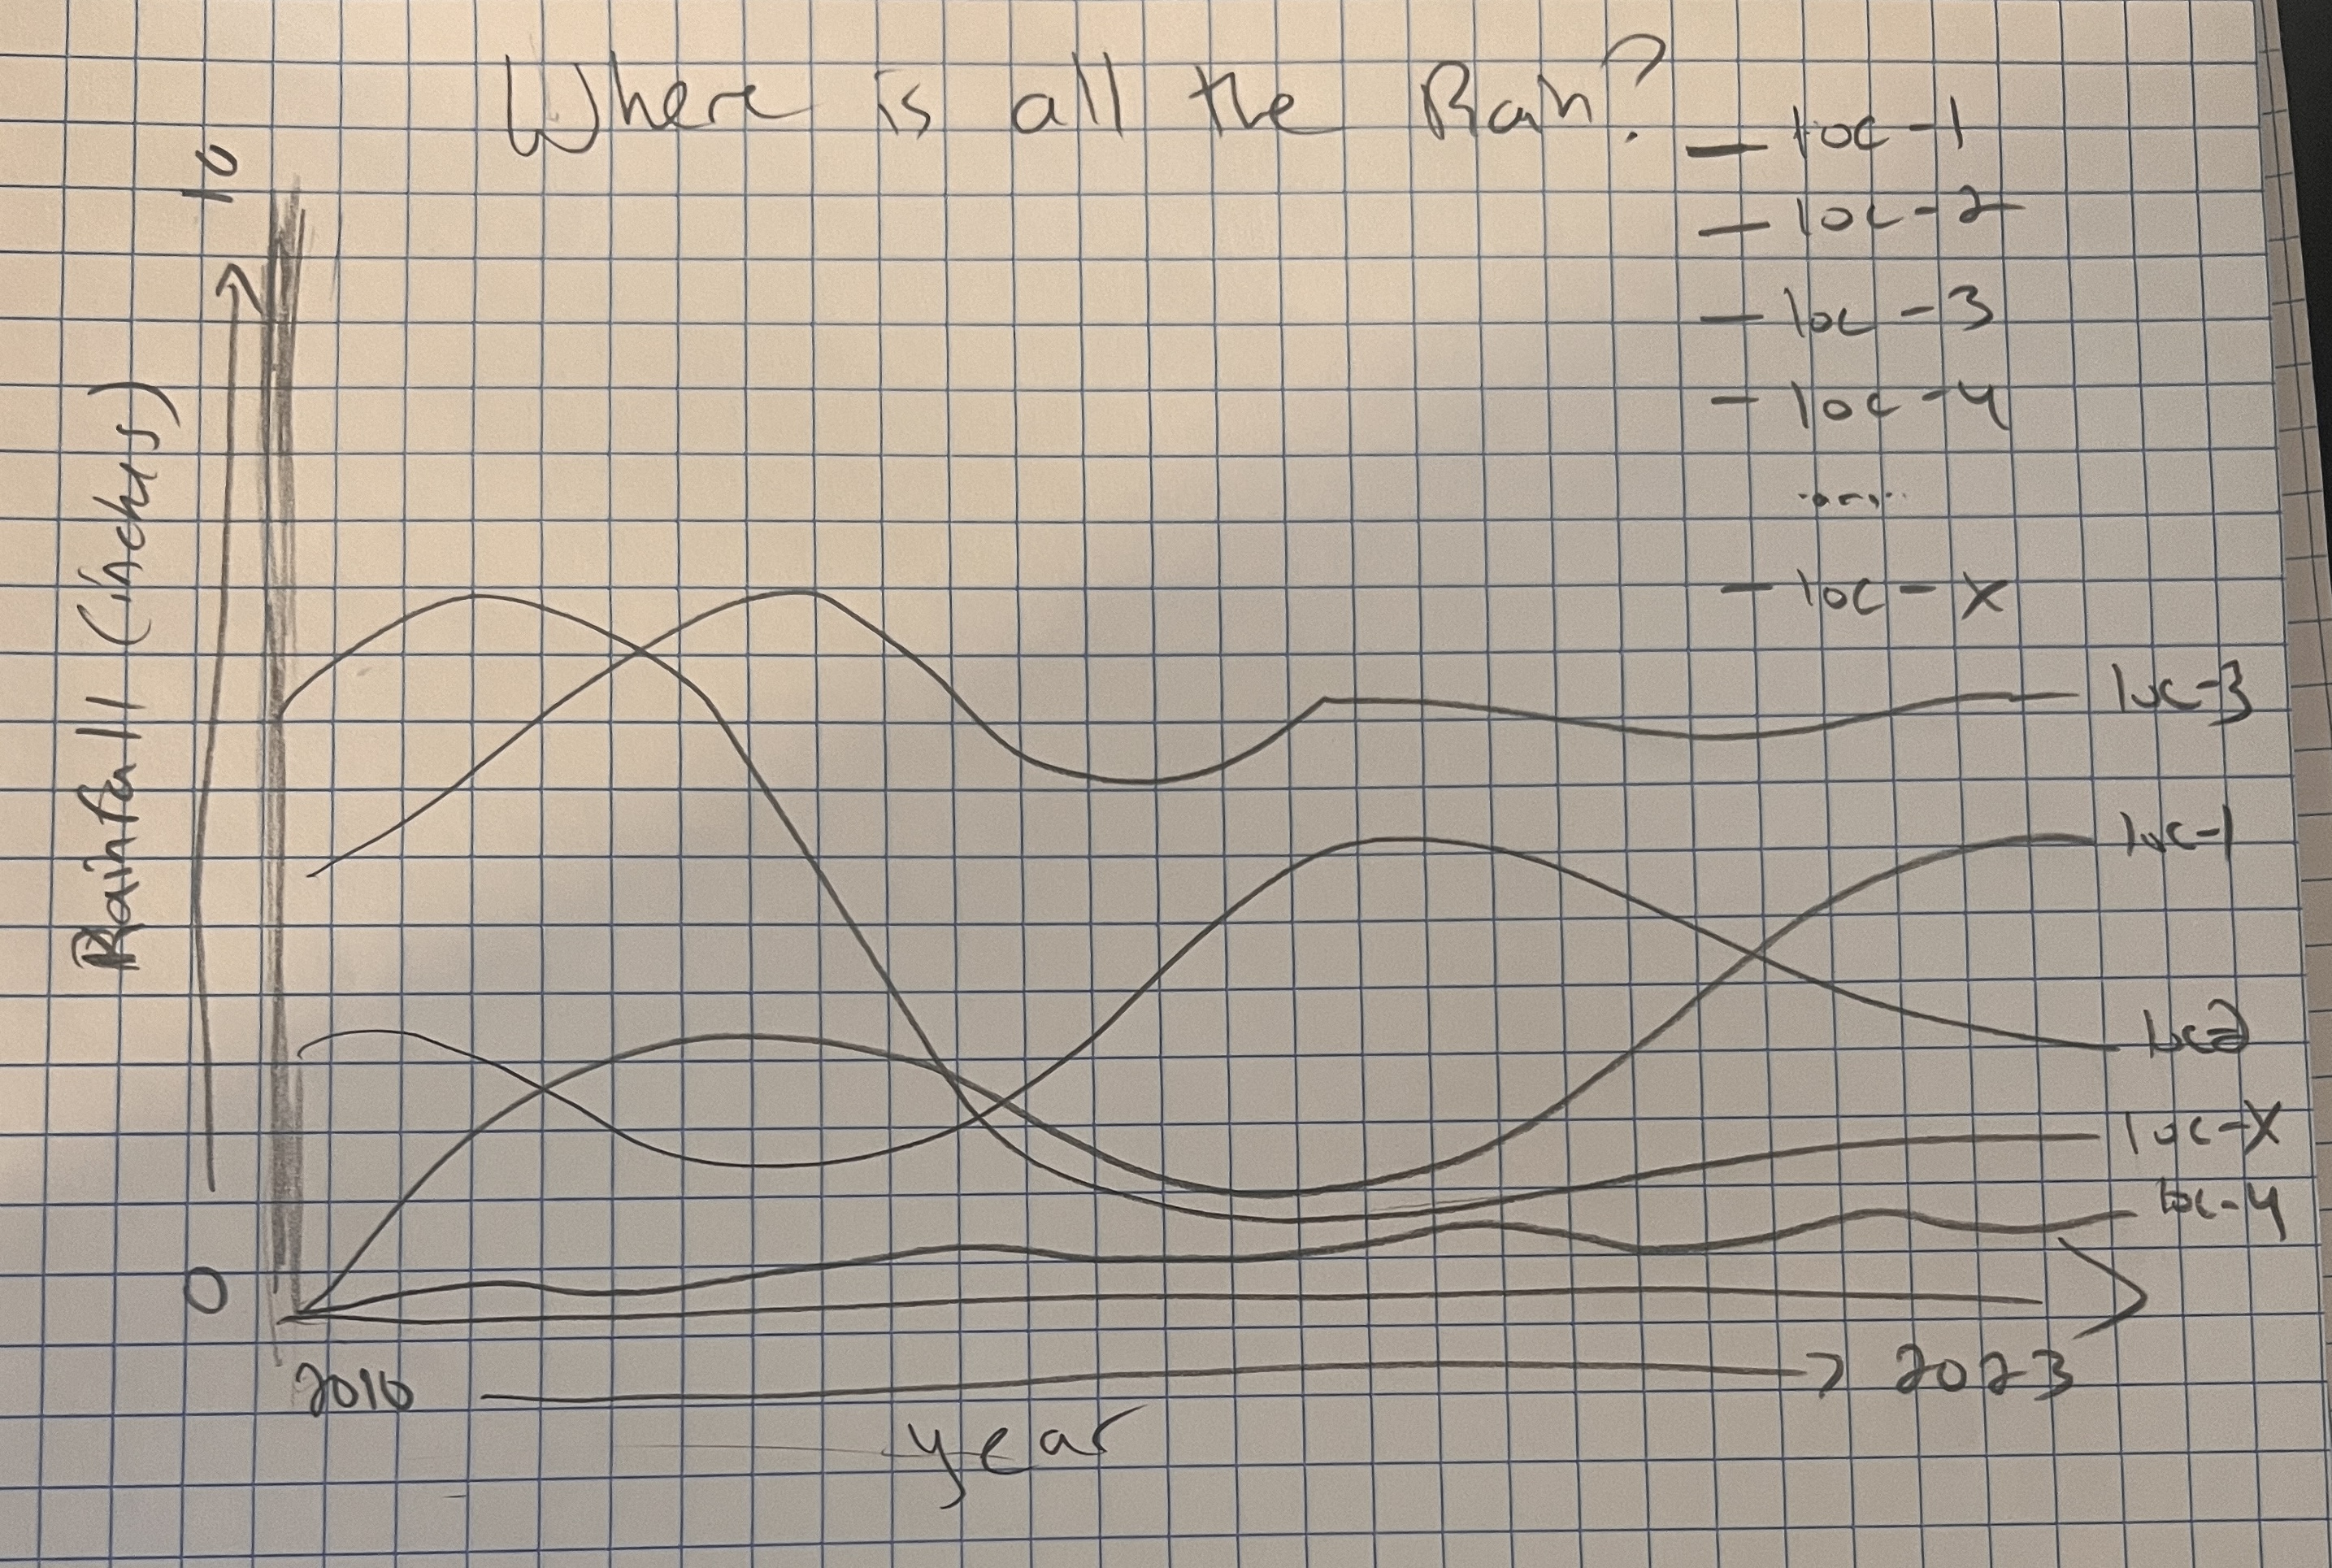
1 - Hand Sketch